Section 01 · The Field E-02
The Diffusive Badge
No pump, no power — molecules arrive by diffusion alone, at a rate the geometry fixes, and what you get is a fortnight averaged into a single number.

How Diffusion Becomes a Measurement
A diffusive badge — variously called a passive sampler or diffusion tube — contains no moving parts and draws no current. It works because molecules in air move by Brownian motion, and where a concentration gradient exists, net movement follows it: from higher concentration toward lower. Inside the badge, a sorbent bed holds the arriving molecules. Because the sorbent continuously scavenges them, the concentration at the sorbent face stays effectively zero throughout the exposure period. That fixed boundary condition is the heart of the method.
Fick's first law of diffusion governs the uptake. The mass of compound collected per unit time is proportional to the concentration in the air, multiplied by a geometry-determined constant called the uptake rate (sometimes the sampling rate), expressed in millilitres per minute or cubic centimetres per minute. Uptake rate combines the cross-sectional area of the diffusion path and its length — the distance molecules must travel from the open face of the badge to the sorbent. A wider, shorter path collects faster; a narrower, longer one collects more slowly and reduces the risk of reverse diffusion, or back-diffusion, when concentrations spike and briefly push absorbed material back out. Manufacturers characterise uptake rates empirically, then validate them against pumped reference measurements; accredited laboratories apply the published figure to their results.
What the Badge Actually Reports
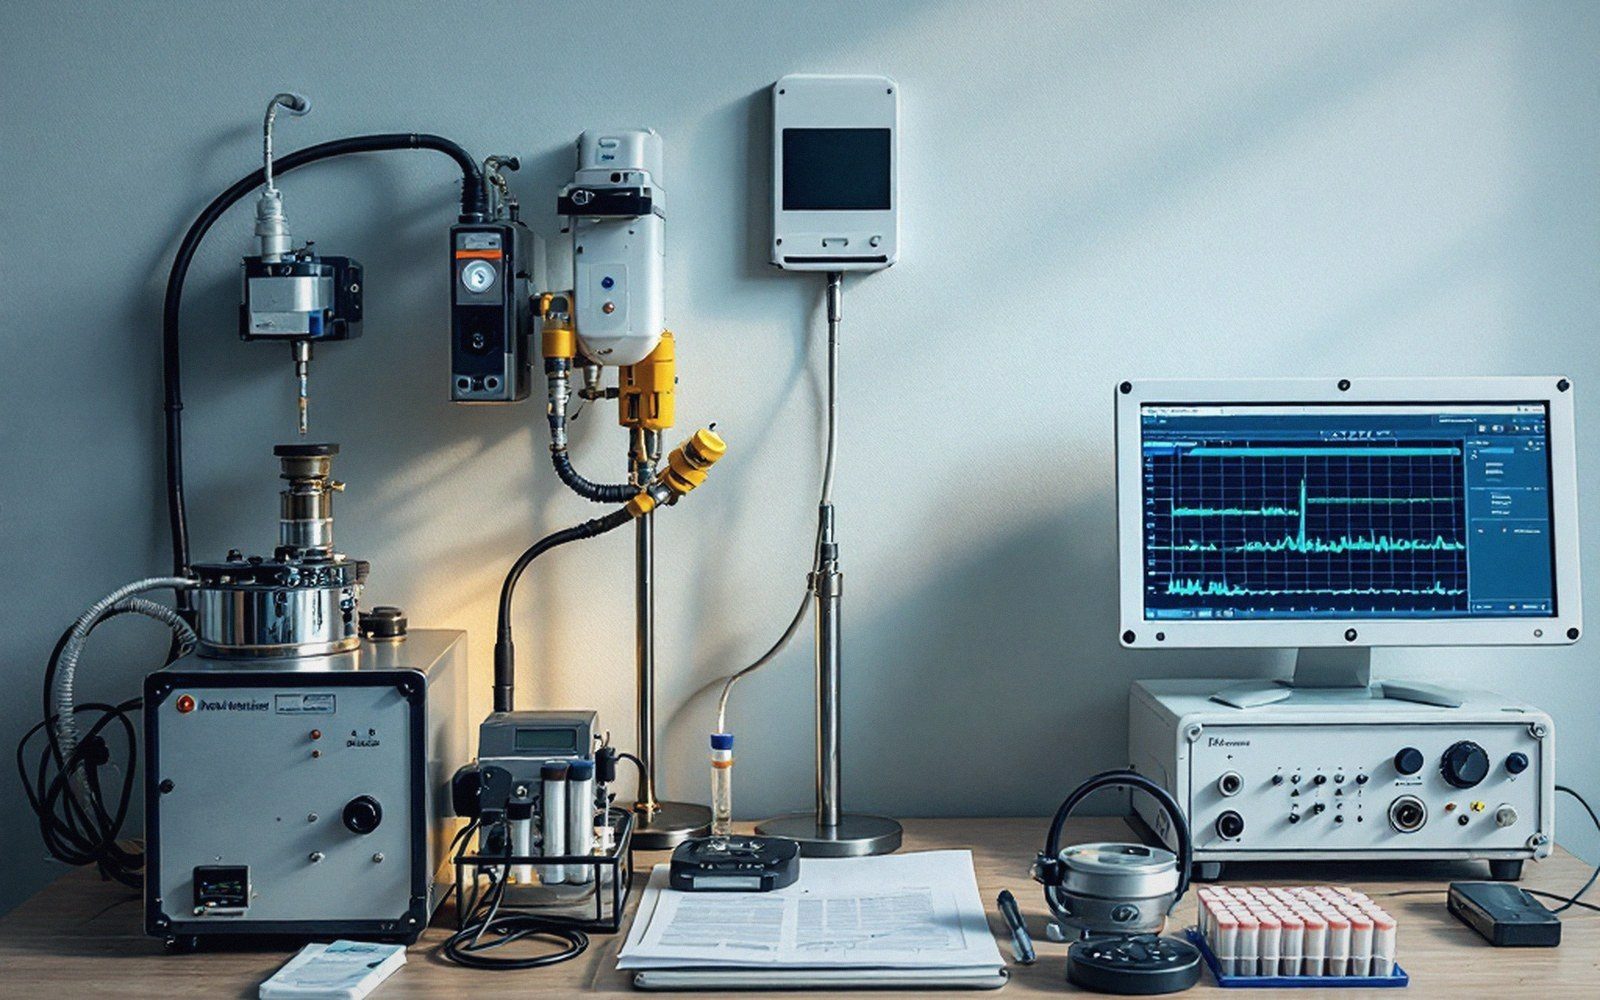
Deploy a badge for seven, fourteen or twenty-eight days, then seal and courier it. In the laboratory, thermal desorption strips the sorbent, and the collected mass is resolved and quantified — the full sequence of the process from tube to number applies here too, including calibration against known standards, identification by retention time, and integration of the chromatographic peak. Divide the mass by the uptake rate and by the deployment time, and you have a time-weighted average (TWA) concentration in micrograms per cubic metre.
That TWA is not incidental — it is the point. A single short-duration measurement captures one moment in conditions that vary hour by hour. A badge left for a full working week or a fortnight averages across day and night cycles, occupancy changes, ventilation fluctuations and weekend shutdowns. Where occupational exposure limits or indoor air guidelines are defined as eight-hour or annual-average concentrations, the badge's long integration window is a virtue, not a compromise.
The practical cost is temporal resolution: nothing inside a badge tells you whether the compound arrived on Tuesday afternoon or Saturday morning. If the question is peak concentration, a badge cannot answer it. A pumped tube — running at a known flow for a known, short period — is the instrument for that question instead.
Deployment, Blanks and the Limit
Deployment is simple enough that badges are used in community monitoring programmes, multi-site occupational surveys and post-remediation checks where running power to dozens of locations is impractical. But simplicity in the field demands rigour in the paperwork. Each badge needs a logged start time, an end time accurate to the nearest fifteen minutes (deployment duration enters the denominator of the calculation directly), temperature and humidity records if possible, and a clear chain of custody from site to laboratory.
Field blanks accompany every deployment batch: sealed badges that travel to site, sit in the sampling area, and return to the laboratory without ever being opened. They capture any contamination introduced during transport, handling or storage. A non-trivial blank changes the reporting limit — and understanding exactly what a blank does to the number is covered in full elsewhere on this site.
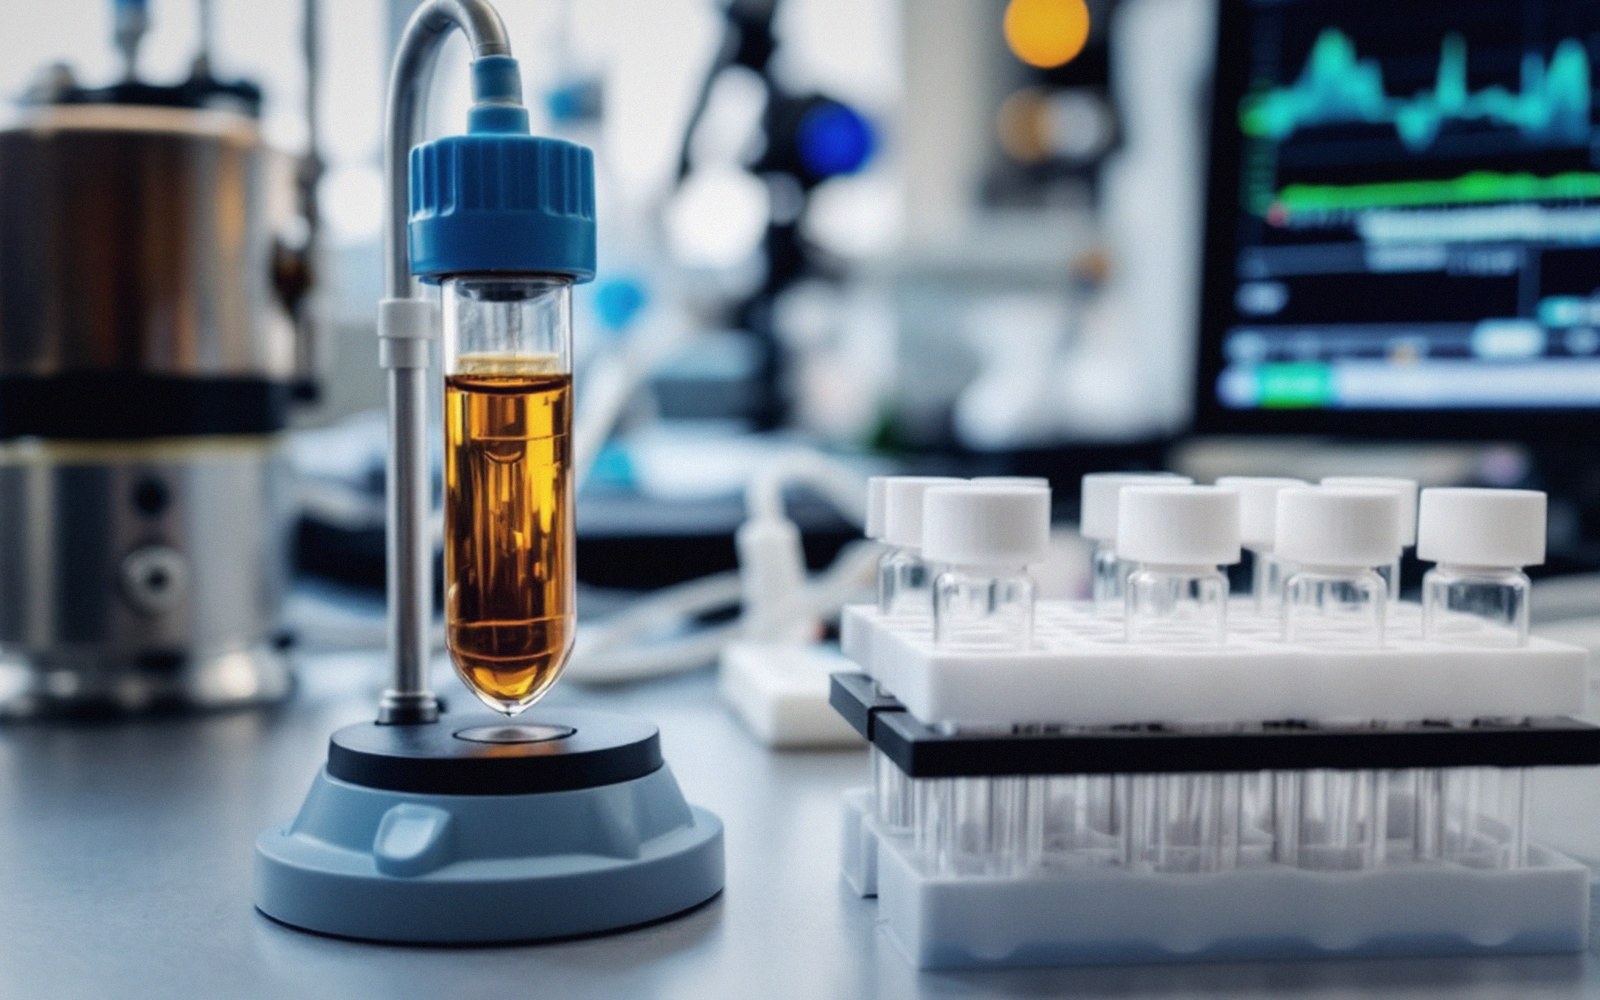
The detection limit of a badge method depends on the analytical sensitivity of the back-end instrumentation, the uptake rate for the specific compound, and the total deployment time. Extending deployment from one week to two effectively halves the detection limit, because twice the mass is collected for the same analytical threshold. This flexibility is one reason badge methods remain a practical first-choice tool: the geometry is fixed, the chemistry is straightforward, and the time axis is something the user controls.
Filed inSection 01 — The Field